

One way the energy industry measures the reliability of power plants is by regularly calculating capacity factors.
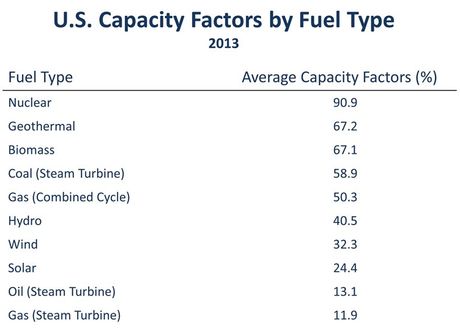
Capacity factor is the measure of how often a power plant runs for a specific period of time. It’s expressed as a percentage and calculated by dividing the actual unit electricity output by the maximum possible output. This ratio is important because it indicates how fully a unit’s capacity is used.
Capacity factors vary considerably by plant and fuel type (see graphic below). As you can tell, nuclear energy’s average capacity factor is above 90, meaning the average nuclear plant remains on line, generating electricity, more than 90 percent of the time.
 Source: NEI
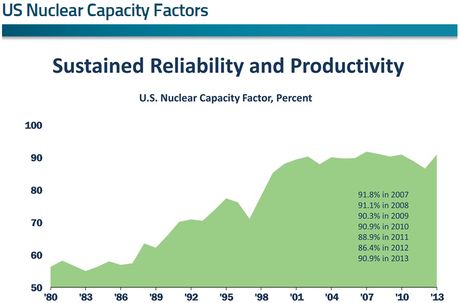
In 2014, the 100 operating nuclear plants in the U.S. had an average capacity factor of 91.8 percent. This is the highest level ever recorded and attributed to the fact that nuclear plants had fewer and shorter refueling and maintenance outages and less unplanned outages. In 2014, the average refueling outage duration was 37.2 days compared to 41 days in 2013 and 46 days in 2012.
Another factor that increased the U.S. nuclear fleet’s 2014 capacity factor was the fleet’s strong performance in December 2014, when the capacity factor was 98.9 percent.
Operating at six sites in the Carolinas, Duke Energy’s 11 reactors set a combined capacity factor record of 93.18 percent in 2014. This marked the 16th straight year the fleet achieved a capacity factor greater than 90 percent. The fleet also had a capacity factor of 97.04 percent for the summer months (June – August).
 Source: NEI
In addition to supplying nearly 20 percent of America’s electricity, nuclear energy is a proven, dependable source, providing on-demand baseload electricity around the clock – whether during record heat or arctic cold.

Comments (1)